EiC
EaRL in Classroom (EiC) is a program aimed at getting undergraduate physics students involved and interested in experimental physics. Students are exposed to a variety of experimental techniques and equipment, allowing them to develop a familiarity with many of the tools presently used by researchers. We worked in conjunction with several undergraduate professors to develop a curriculum for undergraduates which complemented their theoretical coursework.
Students make a polymer-like material out of household ingredients and study how the mechanical properties of their material change when the formulation or processing conditions are altered. Groups modify their material to fulfill a specific goal, such as to make it break faster, to increase the spring constant, or to decrease the spring constant (all when compared to a reference polymer). The force on and extension of the material are tested with the Instron. Students then analyze this data to determine the spring constant and break point.
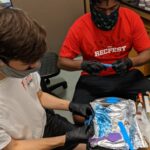
Brendan Santoianni and Rohin Roy making their material and testing it with the Instron.
In this lab, students build a circuit with varying resistance to illuminate a light emitting diode (LED). They are given several types of clays of unknown resistance and a goal of building a circuit that generates a particular intensity of light at a particular wavelength. Groups determine which LED emits their desired wavelength using the Ocean Optics UV-Vis spectrometer, and then vary the intensity of the LED (as measured on the spectrometer) by reshaping the clay connections, which varies the total resistance of the circuit. They are then able to measure the resistance of each element and determine the resistivity of the clay.
In this experiment, students use OceanOptics USB4000 spectrometer to record the absorption spectrum of solutions of conjugated aromatic molecules (naphthalene, anthracene, and tetracene). Using particle in a box model and the maximum wavelength at which the absorption occurs, the length of box (effective length of molecule) is determined.

USB4000 Spectrometer (left) and Absorption of spectra polycyclic aromatic hydrocarbons (right)
An AFM (Atomic Force Microscope) is a tool capable of resolution of more than 1000x better than the optical diffraction limit. In this experiment, students investigate the resonance properties of several different AFM cantilevers by installing them in the AFM head and driving them through a range of frequencies. This provides the concept of resonant frequency behavior, while also introducing students to an important experimental tool. The students also learn how to perform a scan on a rigid sample provided by the Asylum Research company. Here, students can obtain an image on the order of a square micron (10^6 times smaller than a square millimeter!)
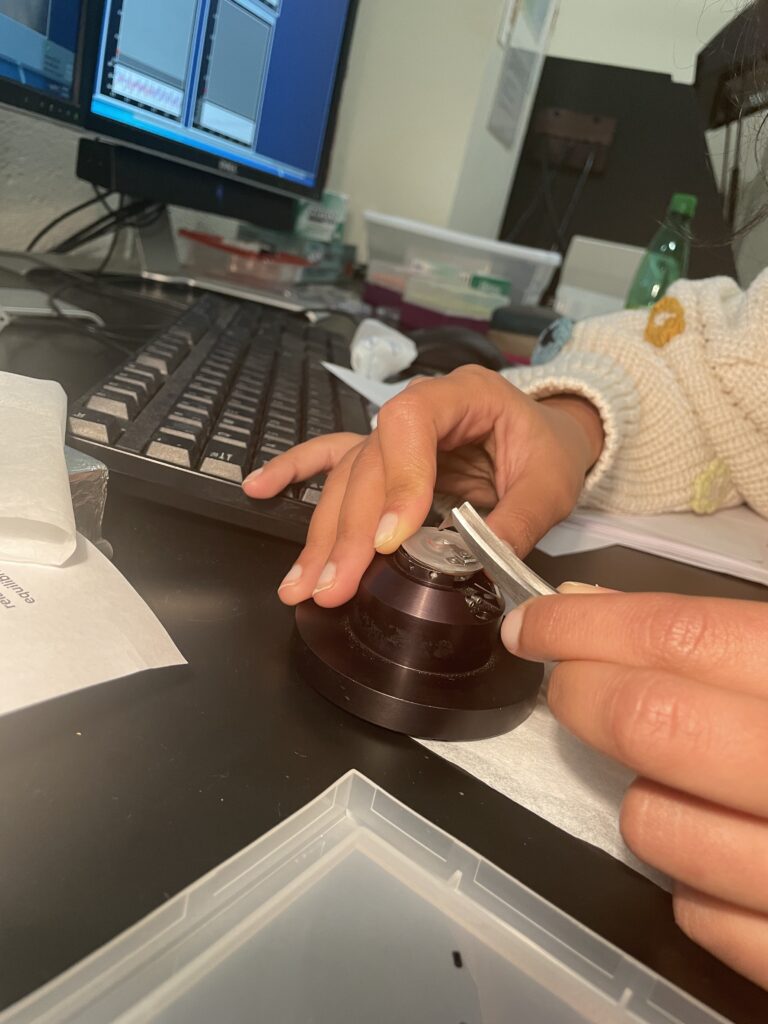
Placing probe
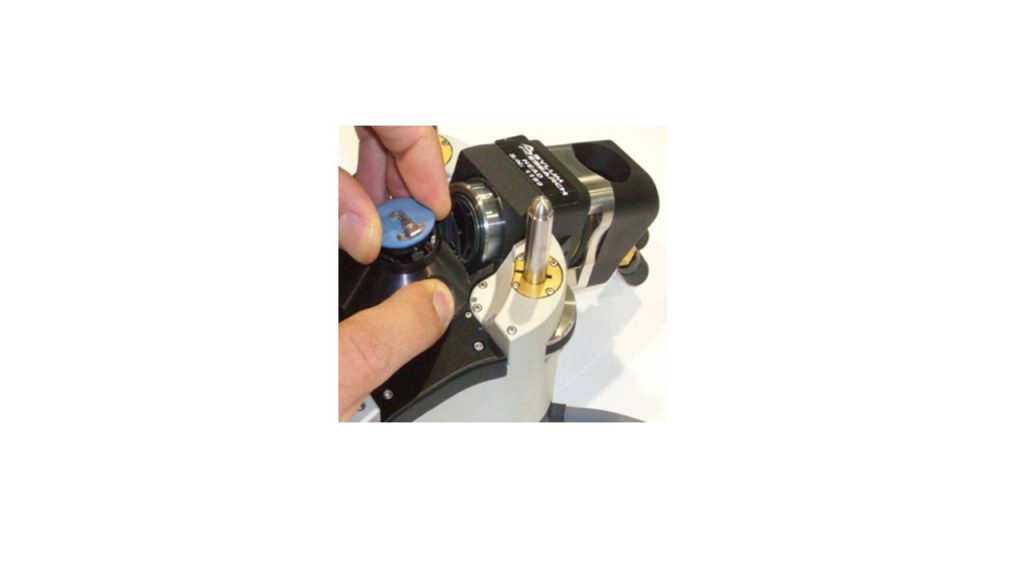
Loading AFM
Students work with magnetic fields in three separate setups to try to achieve chaotic motion or period doubling, quadrupling, etc. In the first setup, a bar magnet is driven at constant angular speed and the students track a compass’ needle to see how it reacts to the changing magnetic field of the bar magnet below it. In the second setup, a compass is placed in between two Helmholtz coils in which students can change the frequency and amplitude of the current going through the coils. The time-dependent magnetic field induces chaotic motion of the compass needle. In the third setup, students go into the clean room to use a microscope to observe magnetic beads that are attached to proteins. The students can see the Brownian motion of the beads, and they will also apply a time-dependent magnetic field and observe the beads under the microscope.
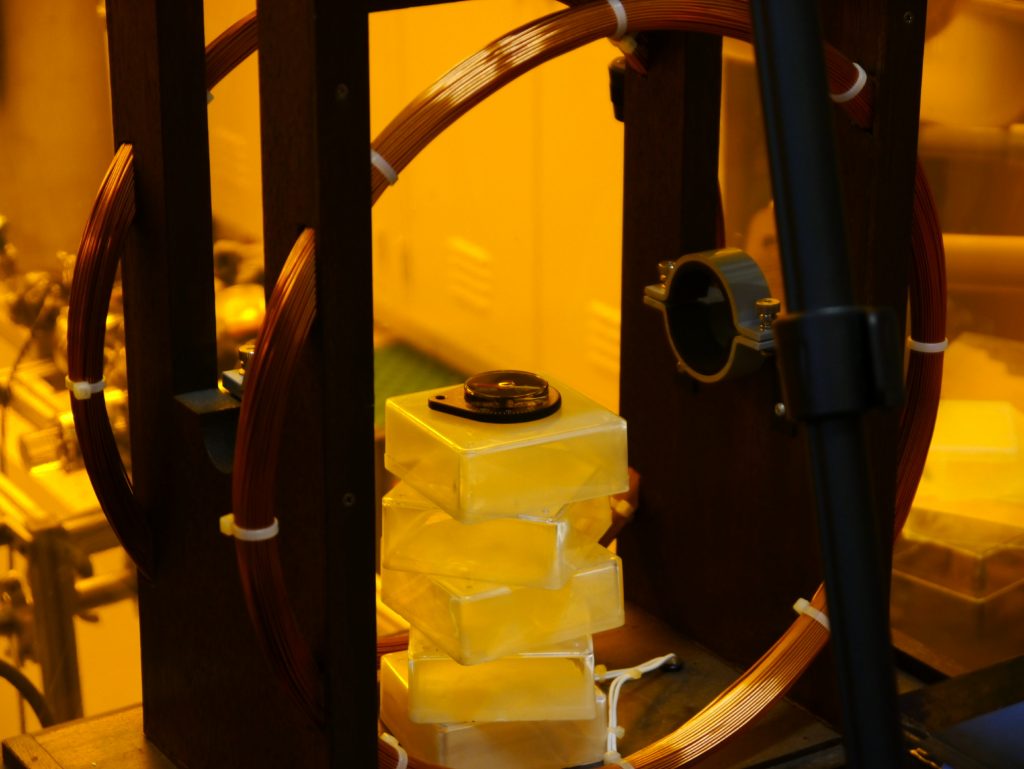
Students track the compass’ needle while adjusting the current through the Helmholtz Coils.
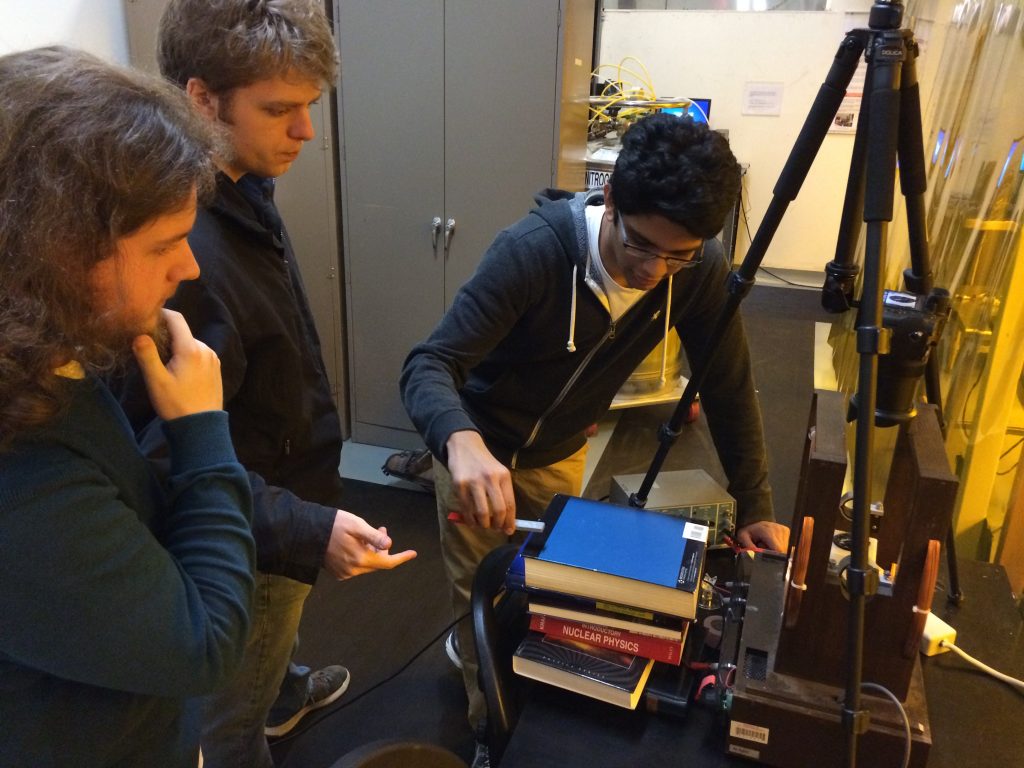
Stewart Marsh, Thomas Chappelow, and Sayam Patel discussing chaos physics.
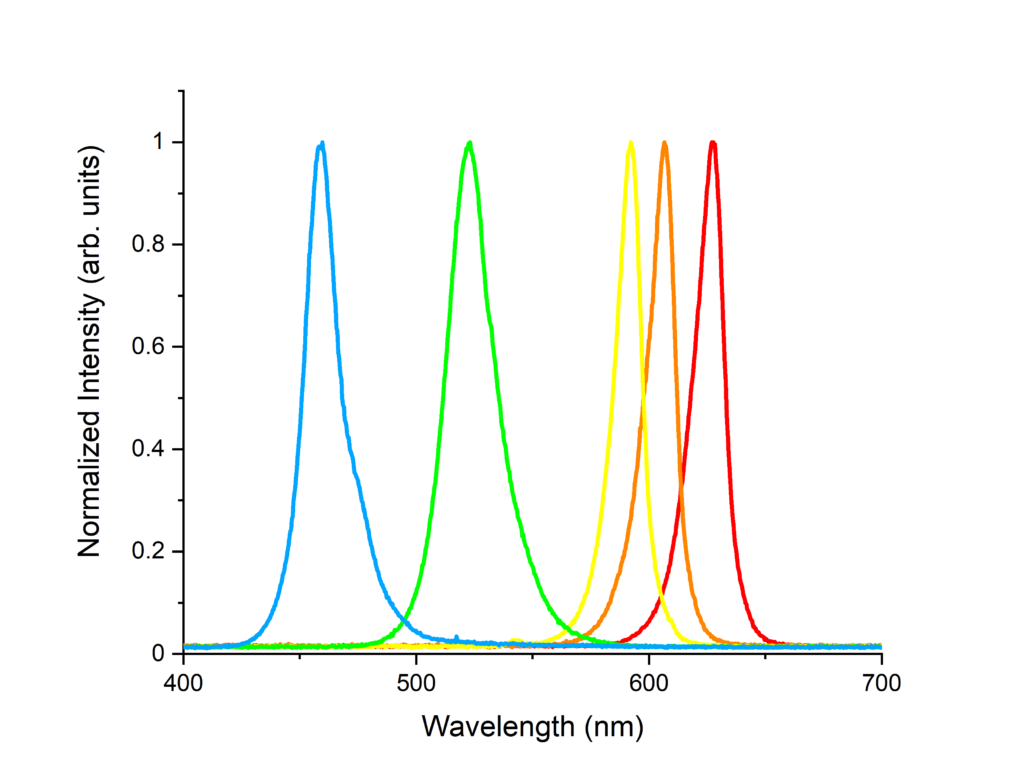
Students observe the absorption spectra of several different Light Emitting Diodes (LEDs). The absorption spectra are recorded using OceanOptics USB4000 spectrometer operating in the visible range. These spectra are analyzed to calculate the temperature of the pn junction of each LED. This is achieved by fitting the absorption curve with a regression model and comparing to the Boltzmann distribution statistics.

LED Lab Setup
Here, students stretch a piece of rubber using a company-grade instrument called an Instron. In this experiment students stretch a rubber band at a known rate while measuring its temperature increase using IR thermometer. They also calculate the change in the entropy associated with mechanical work done on an entropic spring. As well as stretching at a known rate, students also examine the rubber at a fixed, stretched length. Here, they can heat the rubber to see how much force is needed to keep it at that length. They predict resulting change in temperature and compare theoretical expectation with experimental result.
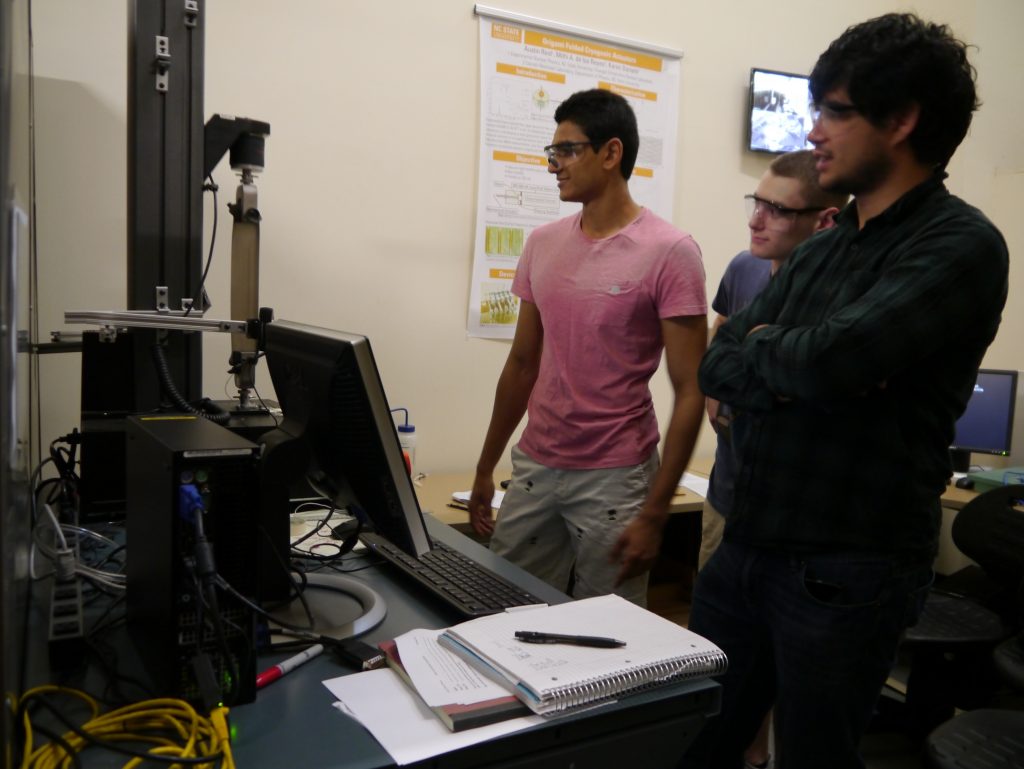
Nachiket Patel, Kenny Ferrari, and Danner Morrison doing entropic springs experiment
Have you ever seen something disappear into thin…liquid? The students performing this lab investigate the index of refraction of solid objects as they dip them into liquids with known index of refraction. If the solid and liquid have the same index of refraction, the solid effectively disappears in a liquid. If two objects have the same index of refraction, then no light is scattered between the two objects, and you can’t tell where the solid is with your naked eye. Additionally, students examine the transmission of light through the solid and liquid using the OceanOptics USB4000 spectrometer.
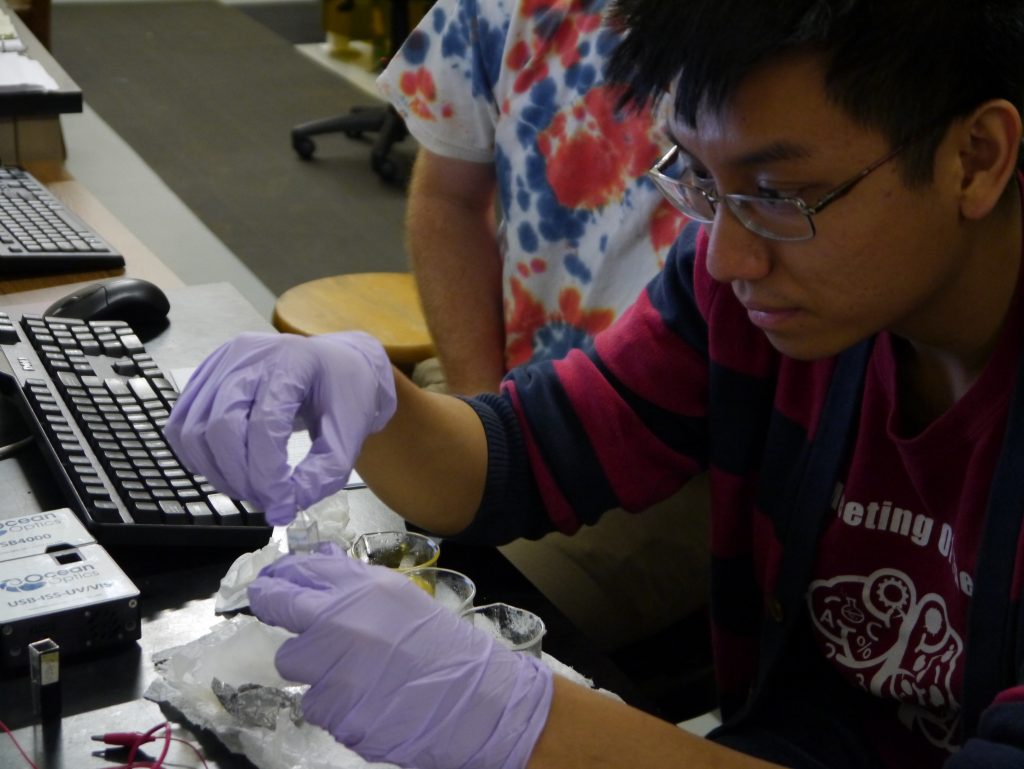
Siu-Kei Chan examining the index of refraction
Students work with a high-purity Germanium (HPGe) detector for use in gamma ray spectroscopy. They measure the gamma spectrum of a sample of brazil nuts, along with the lab background spectrum. They compare measured Thorium chain activities in order to determine the age in years of the sample.
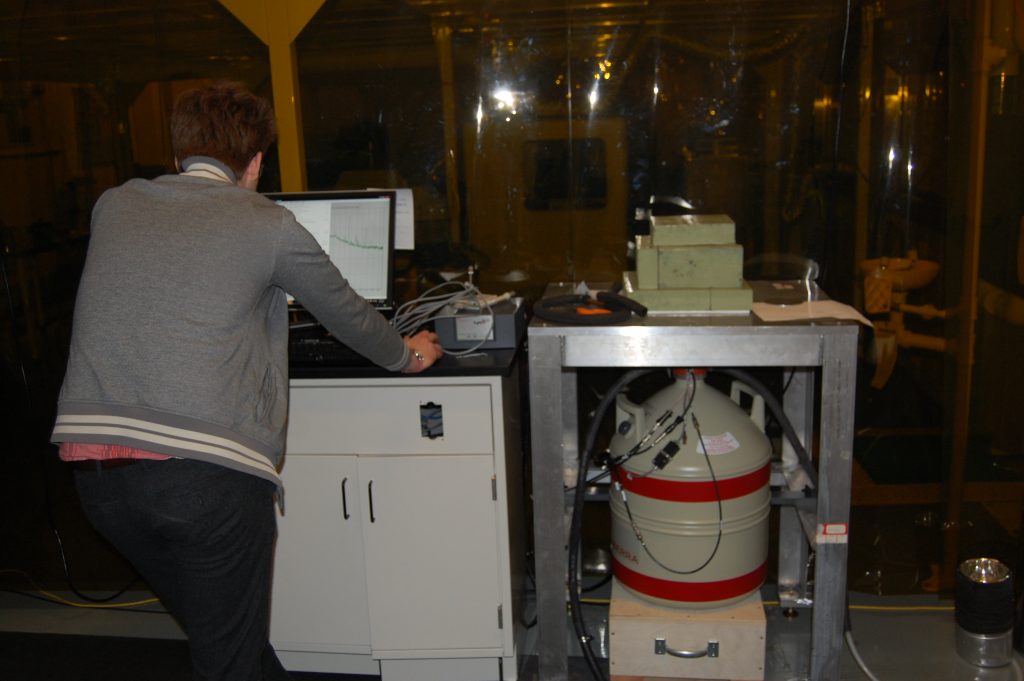
Gabriel Firestone doing gamma ray spectroscopy experiment
Students prepare a sample of DNA in the biophysics labs on the second floor. Using the Atomic Force Microscope (AFM), students image the sample and see multiple strands of DNA (see below). Students then use tracking software ImageJ to measure the end-to-end length of the strands of DNA as well as their total length. Averaging the end-to-end lengths gives a quantity proportional to the persistence length of the DNA in question.
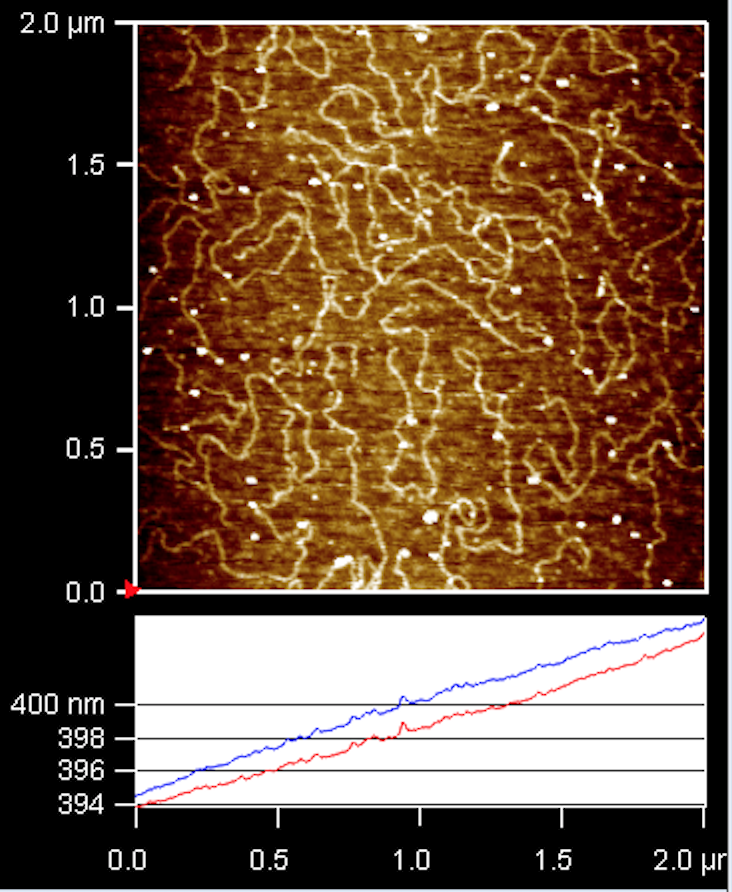
Example of imaged DNA sample.

